DRAW - Shape sub-dialect
The shape sub-dialect allows you to create shapes (drawings) as blocks.
Some aspects of it remind me of "turtle-graphics". You can move your pen without drawing and coordinates can be absolute (relative to the face) or relative (relative to last position).
Shape sub-dialect also "closes" the shapes for you, allowing you to use fill-pen to add colors or patterns.
You may use fill-pen , pen , line-width , line-join and line-cap as commands in the shape block, but only the last command will be used for the entire shape.
The shape sub-dialect is based on SVG graphics. I found the following links to be helpful in understanding some of the concepts:
https://developer.mozilla.org/en-US/docs/Web/SVG/Tutorial/Paths
http://www.w3.org/TR/SVG11/paths.html
⊕ line
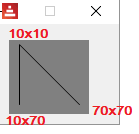
The most basic example:
Red [needs: view]
myshape: [line 10x10 70x70]
view compose/deep/only [
base draw [
shape (myshape)
]
]
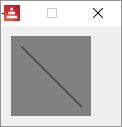
Notice the compose/deep/only and the parentheses around the shape name. As far as I know, you must use those when working with shapes.
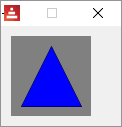
Automatic closing
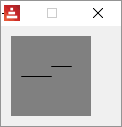
In the example below, only two lines were actually drawn. I added fill-pen to illustrate it better:
Red [needs: view]
myshape: [
line 10x70 40x10 70x70 ;two lines only
]
view compose/deep/only [base draw [ fill-pen blue shape (myshape)]]
⊕ move
The most basic example:
Red [needs: view]
myshape: [
line 10x10 70x70 ;line from 10x10 to 70x70
move 10x70 ;moves the pen without drawing to 10x70
line 10x10 ;draws a line from current pen position (10x70) to 10x10
]
view compose/deep/only [base draw [shape (myshape)]]
relative positions
Coordinates become relative if you add an apostrophe (') before the command:
Red [needs: view]
myshape: [
line 10x40 40x40 ;horizontal line to the middle
'move 0x-10 ;new current position RELATIVE to old (up from the middle)
'line 20x0 ;draws a little horizontal line RELATIVE TO current position
]
view compose/deep/only [base draw [shape (myshape)]]
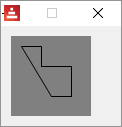
⊕ hline and ⊕ vline
Draws a horizontal or a vertical line from current pen position.
Red [needs: view]
myshape: [
move 10x10 ; puts pen at 10x10
hline 30 ;horizontal line to coordinate X =30
vline 30 ;vertical line to coordinate Y = 30
'hline 30 ;horizontal line 30 pixels long (longer than hline above)
'vline 30 ;vertical line 30 pixels long
'hline -20 ; just to show the use of RELATIVE negative lenghts
; shape dialect will close the shape now
]
view compose/deep/only [base draw [shape (myshape)]]
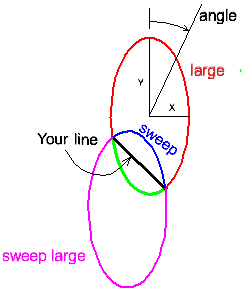
⊕ arc
From Red's official documentation (with eventual minor changes):
Syntax
arc <end> <radius-x> <radius-y> <angle> sweep large (absolute)
'arc <end> <radius-x> <radius-y> <angle> sweep large (relative)
<end> : arc's end point (pair!).
<radius-x> : radius of the circle along x axis (integer! float!).
<radius-y> : radius of the circle along y axis (integer! float!).
<angle> : angle between the starting and ending points of the arc in degrees (integer! float!).
sweep : (optional) draw the arc in the positive angle direction.
large : (optional) produces an inflated arc (goes with 'sweep option).
Description
Draws the arc of a circle between the current pen position and the end point, using radius values. The arc is defined by one angle value.
Here is an explanation about how arc works. Since you define your line (two points) and your ellipse (x-radius, y-radius and angle), there are only two positions for the ellipse that make your line a chord to it. The options sweep, large and sweep large define which arc of these ellipses will show in your drawing. Notice that in the illustration below, the angle of the ellipse is zero.
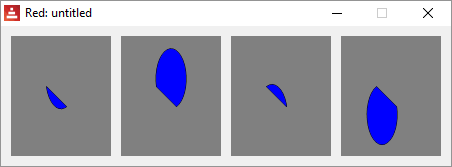
In the arc definition you only inform the arc's end position. That is because the start position is the current pen position. So, if arc is your first command in a shape, you must first move to the position you want to start at.
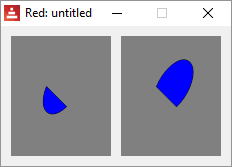
Red [needs: view]
myshape_1: [
move 35x50
arc 55x70 15 30 0
]
myshape_2: [
move 35x50
arc 55x70 15 30 0 large sweep
]
myshape_3: [
move 35x50
arc 55x70 15 30 0 sweep
]
myshape_4: [
move 35x50
arc 55x70 15 30 0 large
]
view compose/deep/only [
base 100x120 draw [fill-pen blue shape (myshape_1)]
base 100x120 draw [fill-pen blue shape (myshape_2)]
base 100x120 draw [fill-pen blue shape (myshape_3)]
base 100x120 draw [fill-pen blue shape (myshape_4)]
]
With an angle:
Red [needs: view]
myshape_1: [
move 35x50
arc 55x70 15 30 30
]
myshape_2: [
move 35x50
arc 55x70 15 30 30 large sweep
]
view compose/deep/only [
base 100x120 draw [fill-pen blue shape (myshape_1)]
base 100x120 draw [fill-pen blue shape (myshape_2)]
]
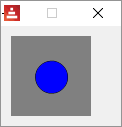
A circle:
Red [needs: view]
myshape_1: [
move 56x40
arc 56x41 16 16 0 large
]
view compose/deep/only [base draw [fill-pen blue shape (myshape_1)]]
⊕ qcurve
From Red's official documentation (with eventual minor changes):
Syntax
qcurve <point> <point> ... (absolute)
'qcurve <point> <point> ... (relative)
<point> : coordinates of a point (pair!).
Description
Draws a quadratic Bezier curve from a sequence of points, starting from the current pen position. At least 2 points are required to produce a curve (the first point is the implicit starting point).
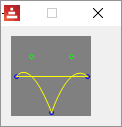
Draw a quadratic Bezier curve from a sequence of 3 points. The following script draws two qcurves using <start-point> <control-point > <end-point/start-point> <control-point > <end-point>. Allows absolute or relative (for relative, use 'qcurve) coordinates.
Red [needs: view]
myshape: [
move 5x40
qcurve 20x20 40x76 60x20 76x40
]
view compose/deep/only [
base draw [
pen blue
circle 5x40 2 ;shows start point 1
circle 40x76 2 ;shows endpoint 1/start point 2
circle 76x40 2 ;shows endpoint 2
pen green
circle 20x20 2 ;shows control point 1
circle 60x20 2 ;shows control point 2
pen yellow
shape (myshape)
]
]
I added the approximate location of the fixed-points (blue) and the control-points (green) in the image bellow. They are not generated by the program, I edited the image.
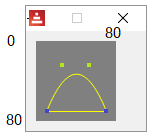
⊕ curve
From Red's official documentation (with eventual minor changes):
Syntax
curve <point> <point> <point> ... (absolute)
'curve <point> <point> <point> ... (relative)
<point> : coordinates of a point (pair!).
Description
Draws a cubic Bezier curve from a sequence of points, starting from the current pen position. At least 3 points are required to produce a curve (the first point is the implicit starting point).
Draws a cubic Bezier curve using <start-point (current pen position)> <control-point1 (argument)> <control-point2 (argument)> <end-point (argument)> . Allows absolute or relative (for relative, use 'curve) coordinates.
Red [needs: view]
myshape_1: [
move 10x70 ; start-point
curve 30x20 50x20 70x70 ; control-point control-point end-point
]
view compose/deep/only [base draw [ pen yellow shape (myshape_1)]]
I added the approximate location of the fixed-points (blue) and the control-points (green) in the images bellow. They are not generated by the program, I edited them.
You may add more points to the curve command, they will create a new independent curve:
Red [needs: view]
myshape_1: [
move 10x70 ; start-point
curve 30x20 ;first control point
50x20 ;second control point
70x70 ;end-point first curve/ new start-point second curve
90x40 ;first control point second curve
110x100 ;second control point second curve
130x70 ;end-point second curve
]
view compose/deep/only [base 150x100 draw [ pen yellow shape(myshape_1)]]
⊕ qcurv
Syntax
qcurv <point> (absolute)
'qcurv <point> (relative)
<point> : coordinates of the ending point (pair!).
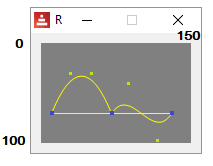
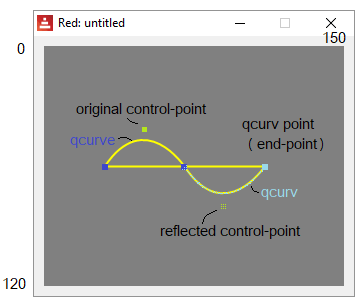
qcurv draws a smooth quadratic Bezier from the current pen position to the specified point.
You don't have to provide the control-point between start-point and end-point, qcurv creates this control-points as a reflection of the last control point given in the shape block, so, you must have a command that uses a control-point before using qcurv.
Red [needs: view]
myshape_1: [
move 30x60 ;start-point of qcurve
qcurve 50x30 70x60 ;control-point end-point
qcurv 110x60 ; end-point of qcurv
]
view compose/deep/only [
base 300x240 draw [
scale 2 2 ; just to make it bigger
pen yellow
shape (myshape_1)
]
]
As of april 2018, qcurv only works with one endpoint as argument.
⊕ curv
Draws a smooth cubic Bezier curve from a sequence of points.
Just like qcurv, curv creates control-points reflected relative to the last control-point in the shape block. But since cubic Beziers require 2 control-points, you must provide the second for each segment. This second control-point will be reflected as the first control-point of the next segment.
From Red's official documentation (with eventual minor changes):
Syntax
curv <point> <point> ... (absolute)
'curv <point> <point> ... (relative)
<point> : coordinates of a point (pair!).
Description
Draws a smooth cubic Bezier curve from a sequence of points, starting from the current pen position. At least 2 points are required to produce a curve (the first point is the implicit starting point).
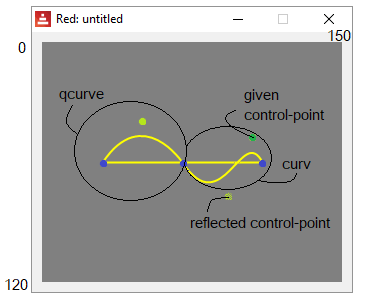
"The first control point is assumed to be the reflection of the second control point on the previous command relative to the current point. (If there is no previous curve command, the first control point is the current point.)"
So, curv draws a cubic Bezier using <current pen position start-point ><automatically created reflected control-point1><control-point2> <end-point>.
So, the arguments you actually pass to curv are only: <control-point2> <end-point>[...]
Red [needs: view]
myshape_1: [
move 30x60 ;start-point of qcurve
qcurve 50x30 70x60 ;control-point end-point
curv 100x40 110x60 ; curv's second control-point and end-point
]
view compose/deep/only [
base 300x240 draw [
scale 2 2 ; just to make it bigger
pen yellow
shape (myshape_1)
]
]
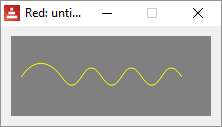
curv may use many consecutive control-points and points:
Red [needs: view]
;second control-point point
myshape_1: [
move 10x40
qcurve 30x10 50x40
curv 70x10 90x40 110x10 130x40 150x10 170x40
move 10x40
]
view compose/deep/only [base 200x80 draw [ pen yellow shape (myshape_1)]
]